Seasonality I: day-of-the-month

This series looks at US stock market seasonality on various timeframes.  The Fama-French (FF) daily book-to-market (B/M) portfolios are used.

Marketsci has posted extensively on this topic, showing that “strong” and “weak” days tend to persist on a walk-forward basis.

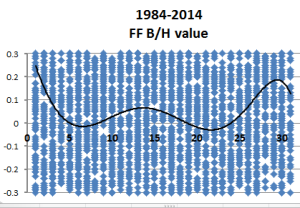
This analysis is slightly different in that calendar days are used rather than trading days.  Daily return is plotted against day of the month from 1984-2014.

Capture3

The trendline shows that calendar days 1,2 and 25-31 have higher average returns than other days, irrespective of where the weekend falls.

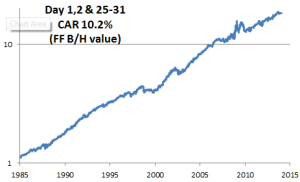
Holding the FF large value portfolio on days 1,2 and 25-31 results in the following equity curve (frictionless).  Annual return is 10.2% with an exposure around 25% and 12 trades per year.

Capture2

It’s interesting that even during the last 2 recessions, these days perform well.  (See 2000-2002 and 2008).

This may work better with the addition of short term entry and exit triggers but I have yet to investigate.  The intent of the equity curve is only to illustrate the principle.

Next up: day-of-year seasonality.

$NAMO signal follow-up

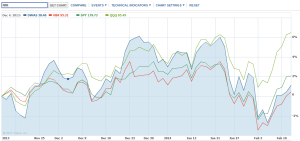
Following the $NAMO buy signal, QQQ hit new highs today:

Capture

This signal is really only a way to measure a decent amount of selling then the beginning of a bounce.  Unfortunately I do not have the raw data to run the stats.  See the charts page for the current picture.

The $NAMO signal, and similar ones such as breadth thrusts (see Quantifiable Edges), should be more reliable when combined with seasonality and recession tracking.  Seasonality is the subject of the next few posts.


Fama-French momentum: absolute and relative returns

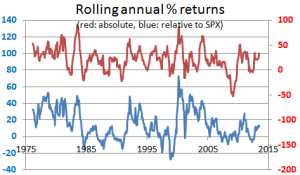
The following charts show rolling annual returns for small-cap momentum, both absolute (red) and relative to the S&P 500 (blue).  The upper trace exhibits a stable mean around 20% but annual return is negative every few years and requires fortitude, as with all long term investing.

The lower trace demonstrates that the strategy can underperform the S&P 500 in some years, notably during the tech bubble in the late 1990s.  Since then, annual underperformance has been rare and limited in magnitude.

Capture10